

If you’re using Docker to host your applications development environment, it will be important to know how to debug your applications source code running in the container. This is the first of a three part series where were going to look at how to debug docker containers running an React.js/Node.js/Express.js application. In this first part were going to look at how to use WebStorm, followed by Visual Studio Code and finally hooking up the good Ol’ fashion node.js debugger.
If you haven’t started, but are interested in hosting your applications development environment inside Docker containers, you’re going to want to check out the recently released Docker for Devs tutorial. If you’re coming directly to this tutorial on debugging docker containers, I’ll be assuming you’re familiar with Docker Compose.
As a bonus, we’re also going to look at nodemon for monitoring server side changes and restarting our server without us having to shutdown and restart containers on ever server-side change.
Getting Started
To easily get up and running, you can use this Github repository to get up and running. Its very similar to the tutorial involving Docker Compose but without the nginx reverse proxy.
Debug Docker Containers
The bottom line is, we need our Docker container to be reachable by an external debugger. In our case, we want to configure WebStorm’s Node.js debugging plugin to connect to our running Express.js application’s debugger that is running remotely in our Docker Container. In doing so, we’ll be in a position to debug docker container with WebStorm or other other EDIs which we’ll see in upcoming tutorials.
Therefore, this is a three part series:
- Prepare Docker Compose
- Build Images and Run Containers using Docker Compose
- Configure WebStorm Node.js Remote Debugger plugin
- Connect WebStorm Node.js Remote Interpreter to our application’s debugger
Step 1. Preparing Images
Step 1a. Create Docker Compose File
No different than how we started using Docker Compose in the Docker tutorial, we’re also going to leverage Docker Compose for creating our network, creating our services and their containers in this debug docker container tutorial.
- Create a file in the root of the project and name it “docker-compose.yml”
- Paste in the following:
version: "2.1"

services:
node:
container_name: hackershall-dev-app
image: hackershall-dev-i
build:
context: .
dockerfile: ./.docker/node.dev.dockerfile
ports:
- "7000:7000"
networks:
- hackershall-network
volumes:
- .:/var/app
env_file:
- ./.docker/env/app.dev.env
working_dir: /var/app

mongo:
container_name: hackershall-dev-mongodb
image: mongo:3.4.1
build:
context: .
dockerfile: ./.docker/mongo.dev.dockerfile
env_file:
- ./.docker/env/mongo.dev.env
networks:
- hackershall-network
ports:
- "27017"

networks:
hackershall-network:
driver: bridge
What Did We Do?
- We created a Docker Compose File
- That created a single network named “hackershall-network”
- Specified two services: node and mongo
- and set the services to use the “hackershall-network” network
Step 1b. Debug Ports
Currently, we only have the port 7000 of the container mapped to our local host post 7000. We are using this port to connect to the running application in our container (e.g. http://localhost:7000).
We want to be able to attach WebStorm to a running node.js debugger in our application’s Docker container. To do this, we need to open up the port that our Express.js application debugger will be listening on.
We could specify any port to use by specifying a port along with the –debug flag, when we start our express.js application.
e.g.
node --debug=<custom_port>
However, to keep it as simple as possible, we’re going to stick with the default port that node.js debugger will listen on which 5858.
In order to make it available through our container do the following:
- Inside the docker-compose.yml file, locate the “ports” property, under the “node” service
- add an additional port mapping 5858 to local host port 5858:
ports:
  - "7000:7000"
  - "5858:5858"
What Did We Do?
- We have mapped the port 5858 on the container to our local host port 5858
- If the node.js debugger for our application is listening on port 5858, we’ll be able to connect to it from our host machine.
Step 1c: Updating Dockerfile
When setting up port access to a container there are two parts. Exposing the port on the container and mapping the port from the container to the local host. I thought it might be easier in the overall approach to wire up the port mapping first.
We now need to expose port 5858 from our express.js application image which we’ll specify in the application development Dockerfile:
- Open the file “node.dev.dockerfile” in the .docker directory off the root
- Lets add a new environment variable and its value, locate the ENV line and update with:
ENV NODE_ENV=development
- Update to:
ENV NODE_ENV=development DEBUG_PORT=5858
- Before the CMD command, add the following:
EXPOSE $DEBUG_PORT
Result:
FROM maxmccarty/hackershall-prod-i

ENV NODE_ENV=development DEBUG_PORT=5858

EXPOSE $DEBUG_PORT

CMD ["./.docker/node_scripts/initialize.sh"]
What Did We Do?
- Created a new environment variable DEBUG_PORT
We could have simple exposed Port 58585 (EXPOSE 5858) but we took the liberty to use environment variables - Used the EXPOSE command to expose the value of $DEBUG_PORT (5858)
Step 1d: Updating Our NPM Scripts
We still have one more step to complete to be able to attach WebStorm to a node.js debugger and that is starting our application’s node.js debugger.
- Open the package.json file in the project root
- Locate the NPM script:
"start:server": “babel-node server/server.js,
- Add the –debug flag after babel REPL
"start:server": "babel-node --debug server/server.js",
What Did We Do?
- On our NPM script to start our application,
- we specify the –debug flag in order to start the node.js debugger to be listening
Step 1e: Enabling nodemon
While we already have everything in place to create our application development environment images, lets add nodemon into the mix.
- Going back to the same NPM script we edited in Step 1c, lets make the small change of adding nodemon:
"start:server": "nodemon --debug server/server.js --exec babel-node",
What Did We Do?
- We added the nodemon utility to run our node.js application
- and specified nodemon to execute the babel-node CLI using the —exec option
Step 2: Build Images and Run Containers using Docker Compose
With our dockerfile’s updated to expose the debugger port 5858 from our application container, along with the port mapping to our local host, we’re ready to create the images and generate running containers of our application.
Step 2a: Build Images
- To build the specified Docker Compose images for application and database run the command:
docker-compose build
What did we do?
In that single command of BUILD docker-compose:
- pulled any dependent images
- and built specified images in the docker-compose.yml file.
Step 2b. Generate Containers
- To generate running containers from our build Docker images, run the following command
docker-compose up
- Observe the log messages in the WebStorm terminal that the debugger is listening on port 5858:


What did we do?
Using the UP docker-compose:
- Create the specified network.
- Generated the node and mongo specified containers
- Mongo scripts were ran, admin and various operation accounts created.
- MongoDB and Node service was brought online.
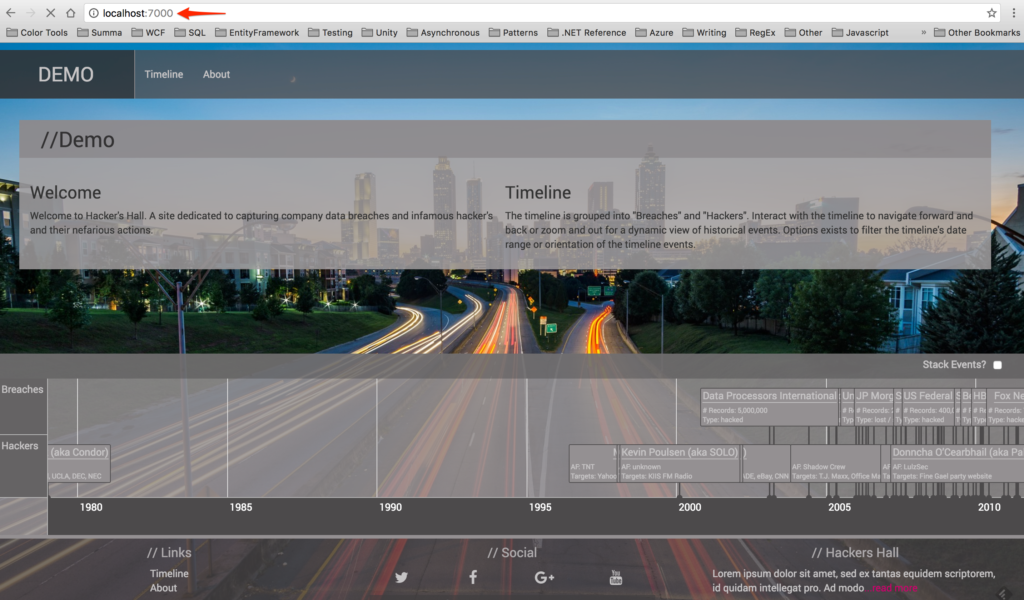
Step 2c. Verify Running Application
- From your browser navigate to http://localhost:7000 to verify the application is running and accessible:

Step 3: Configure WebStorm Node.js Remote Debug plugin
We now have a running container of our application exposing the port 5858, a mapping of 5858 from the container to our local host port 5858 and our application running with the node.js debugger listening.
Before we can use WebStorm to debug docker container, and actually attach to the listening node.js debugger in the container, we have to configure WebStorm’s node.js remote debug plugin so that it knows what address (localhost) and port (5858) the debugger is listening on.
Step 3a: Installing / Enabling Node.js Remote Interpreter Plugin
Depending on your OS, you’re steps might very.
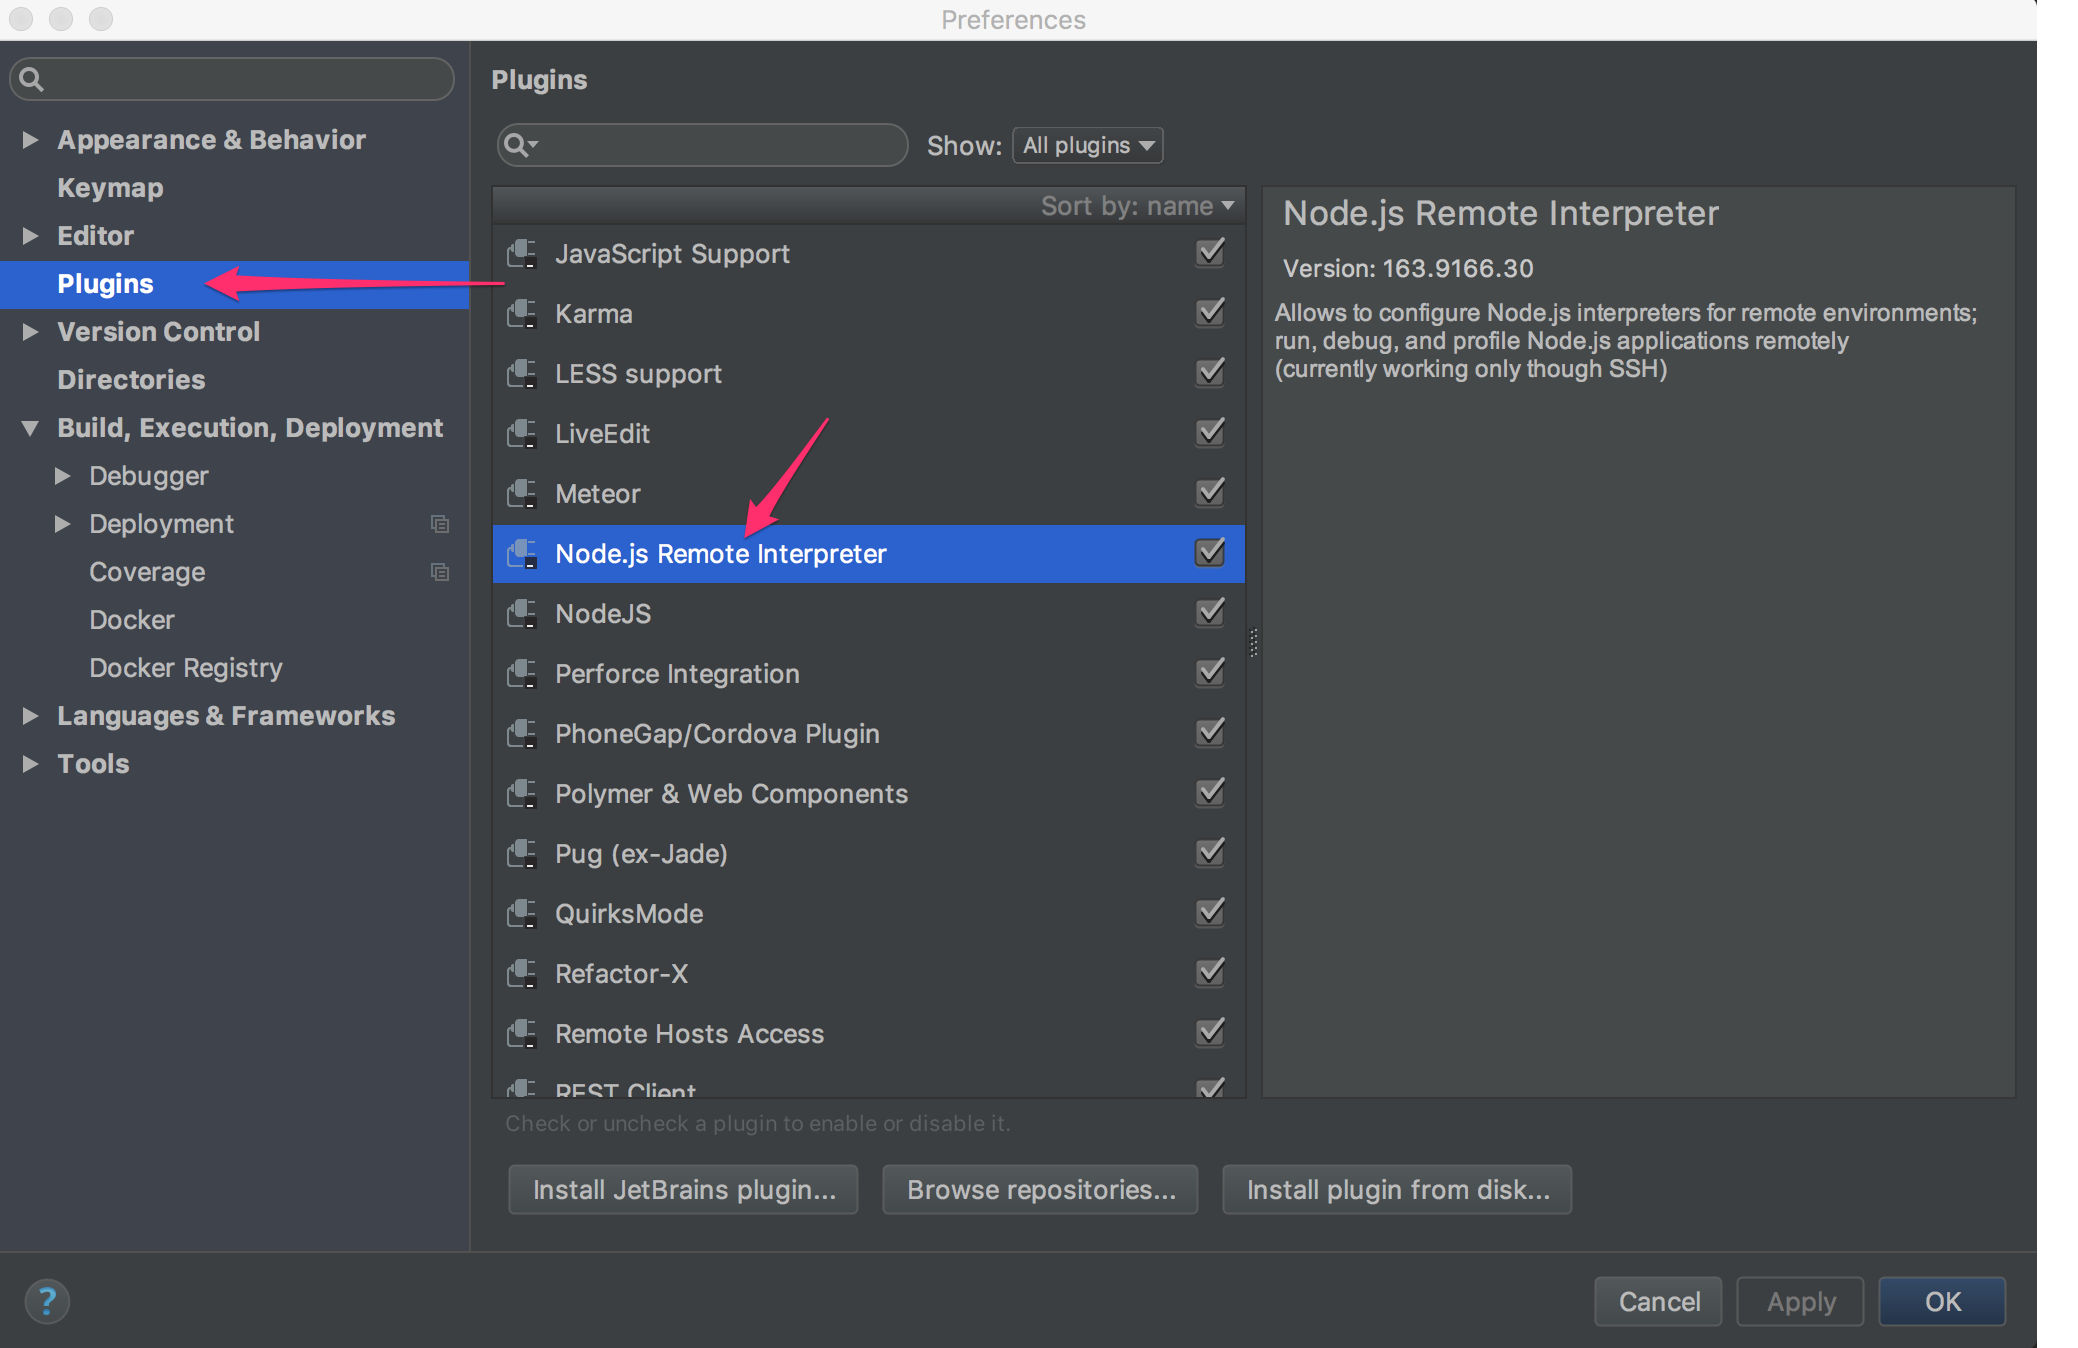
- Open WebStorm preferences
- Click on Plugins
- Locate the Node.js

- If you don’t have it installed you can click on “Install JetBrains Plugins from the same screen and consult this WebStorm documentation.
- Ensure its enabled by checking the box to the right.
Step 3b. Creating Debug Configuration
With the plugin installed and enabled, we need to setup a configuration for this interpreter to connect to our application’s debugger listening on port 5858.
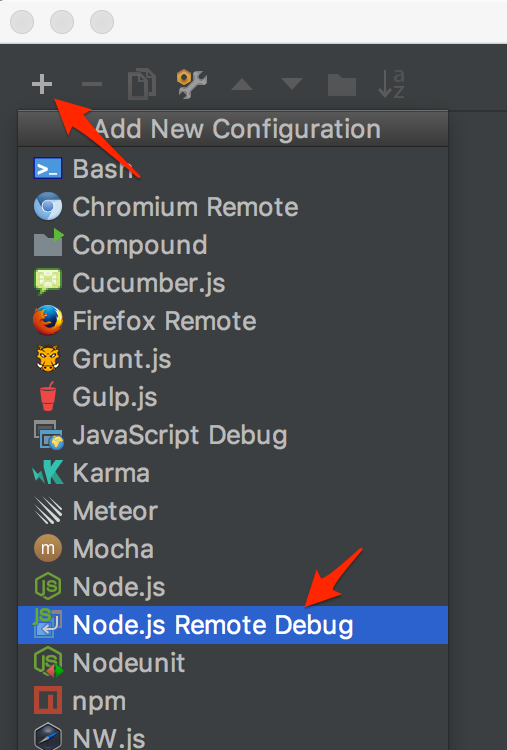
- Off the main WebStorm menu click on Run -> Edit Configuration
- Click on the “+” top left to open the “Add New Configuration” dropdown
- Select “Node.js Remote Debug” from the menu
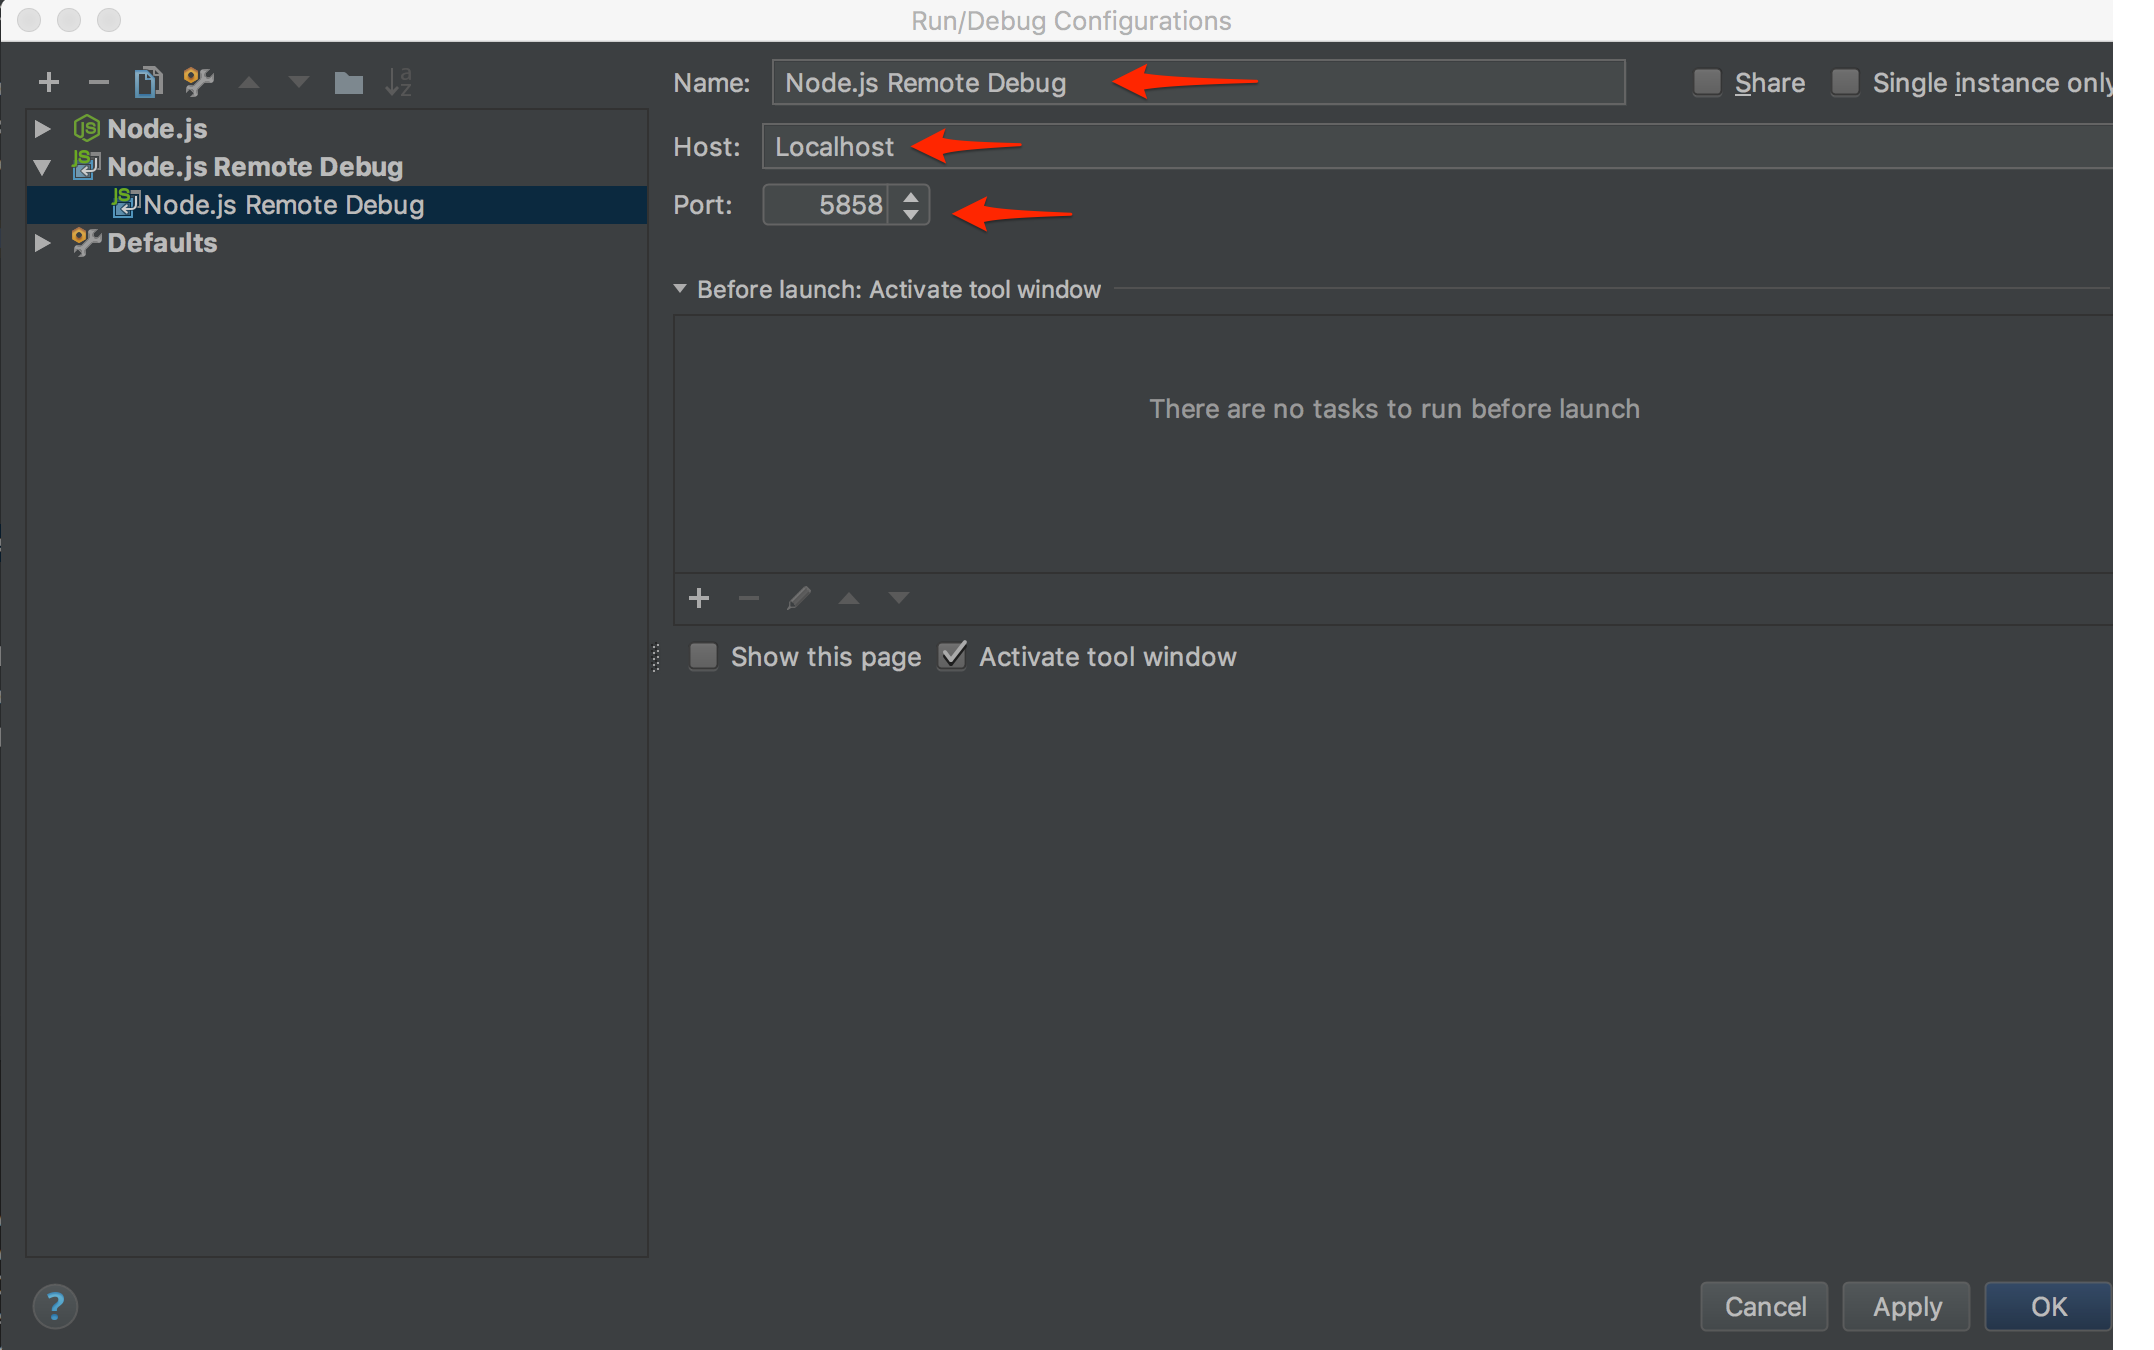
- Provide a name
- Specify “Localhost” for the Host field
- Verify port is at the default 5858
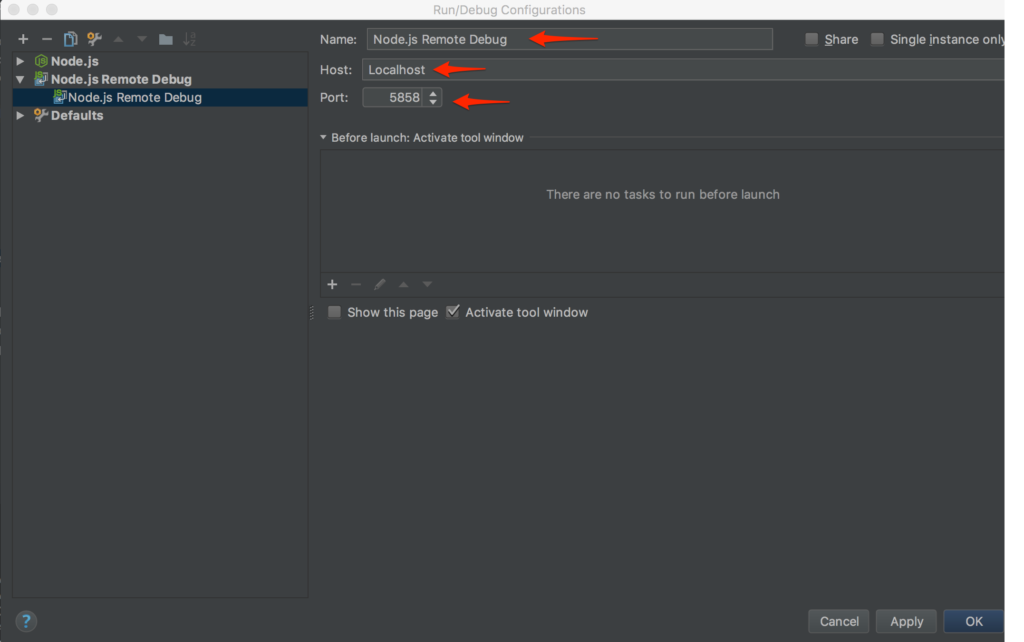
- Click “Apply” then “OK”
Step 4: Connect WebStorm Node.js Remote Interpreter to our application’s debugger
Remember, our application container is running, we now have setup the configuration for WebStorm’s Node.js Remote Interpreter with the information it needs to know where to connect to the listening debugger in our apps container.
We just need to specify the configuration we want to use and set some breakpoints and debug docker.
Step 4a. Select Debugger Configuration
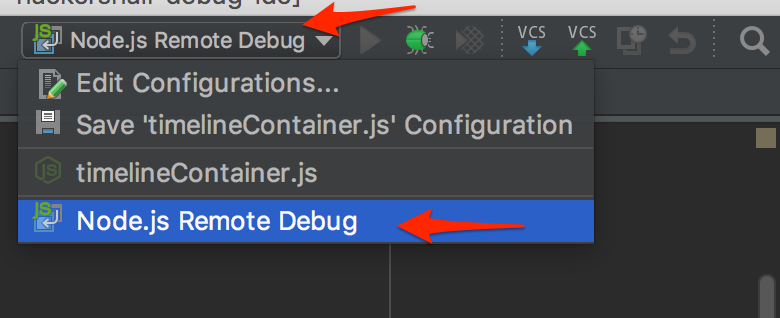
- Locate on the top right of the main WebStorm window a dropdown with Configurations
- Select the one you created and named in the previous step 3b.
Step 4b. Verify Running Application
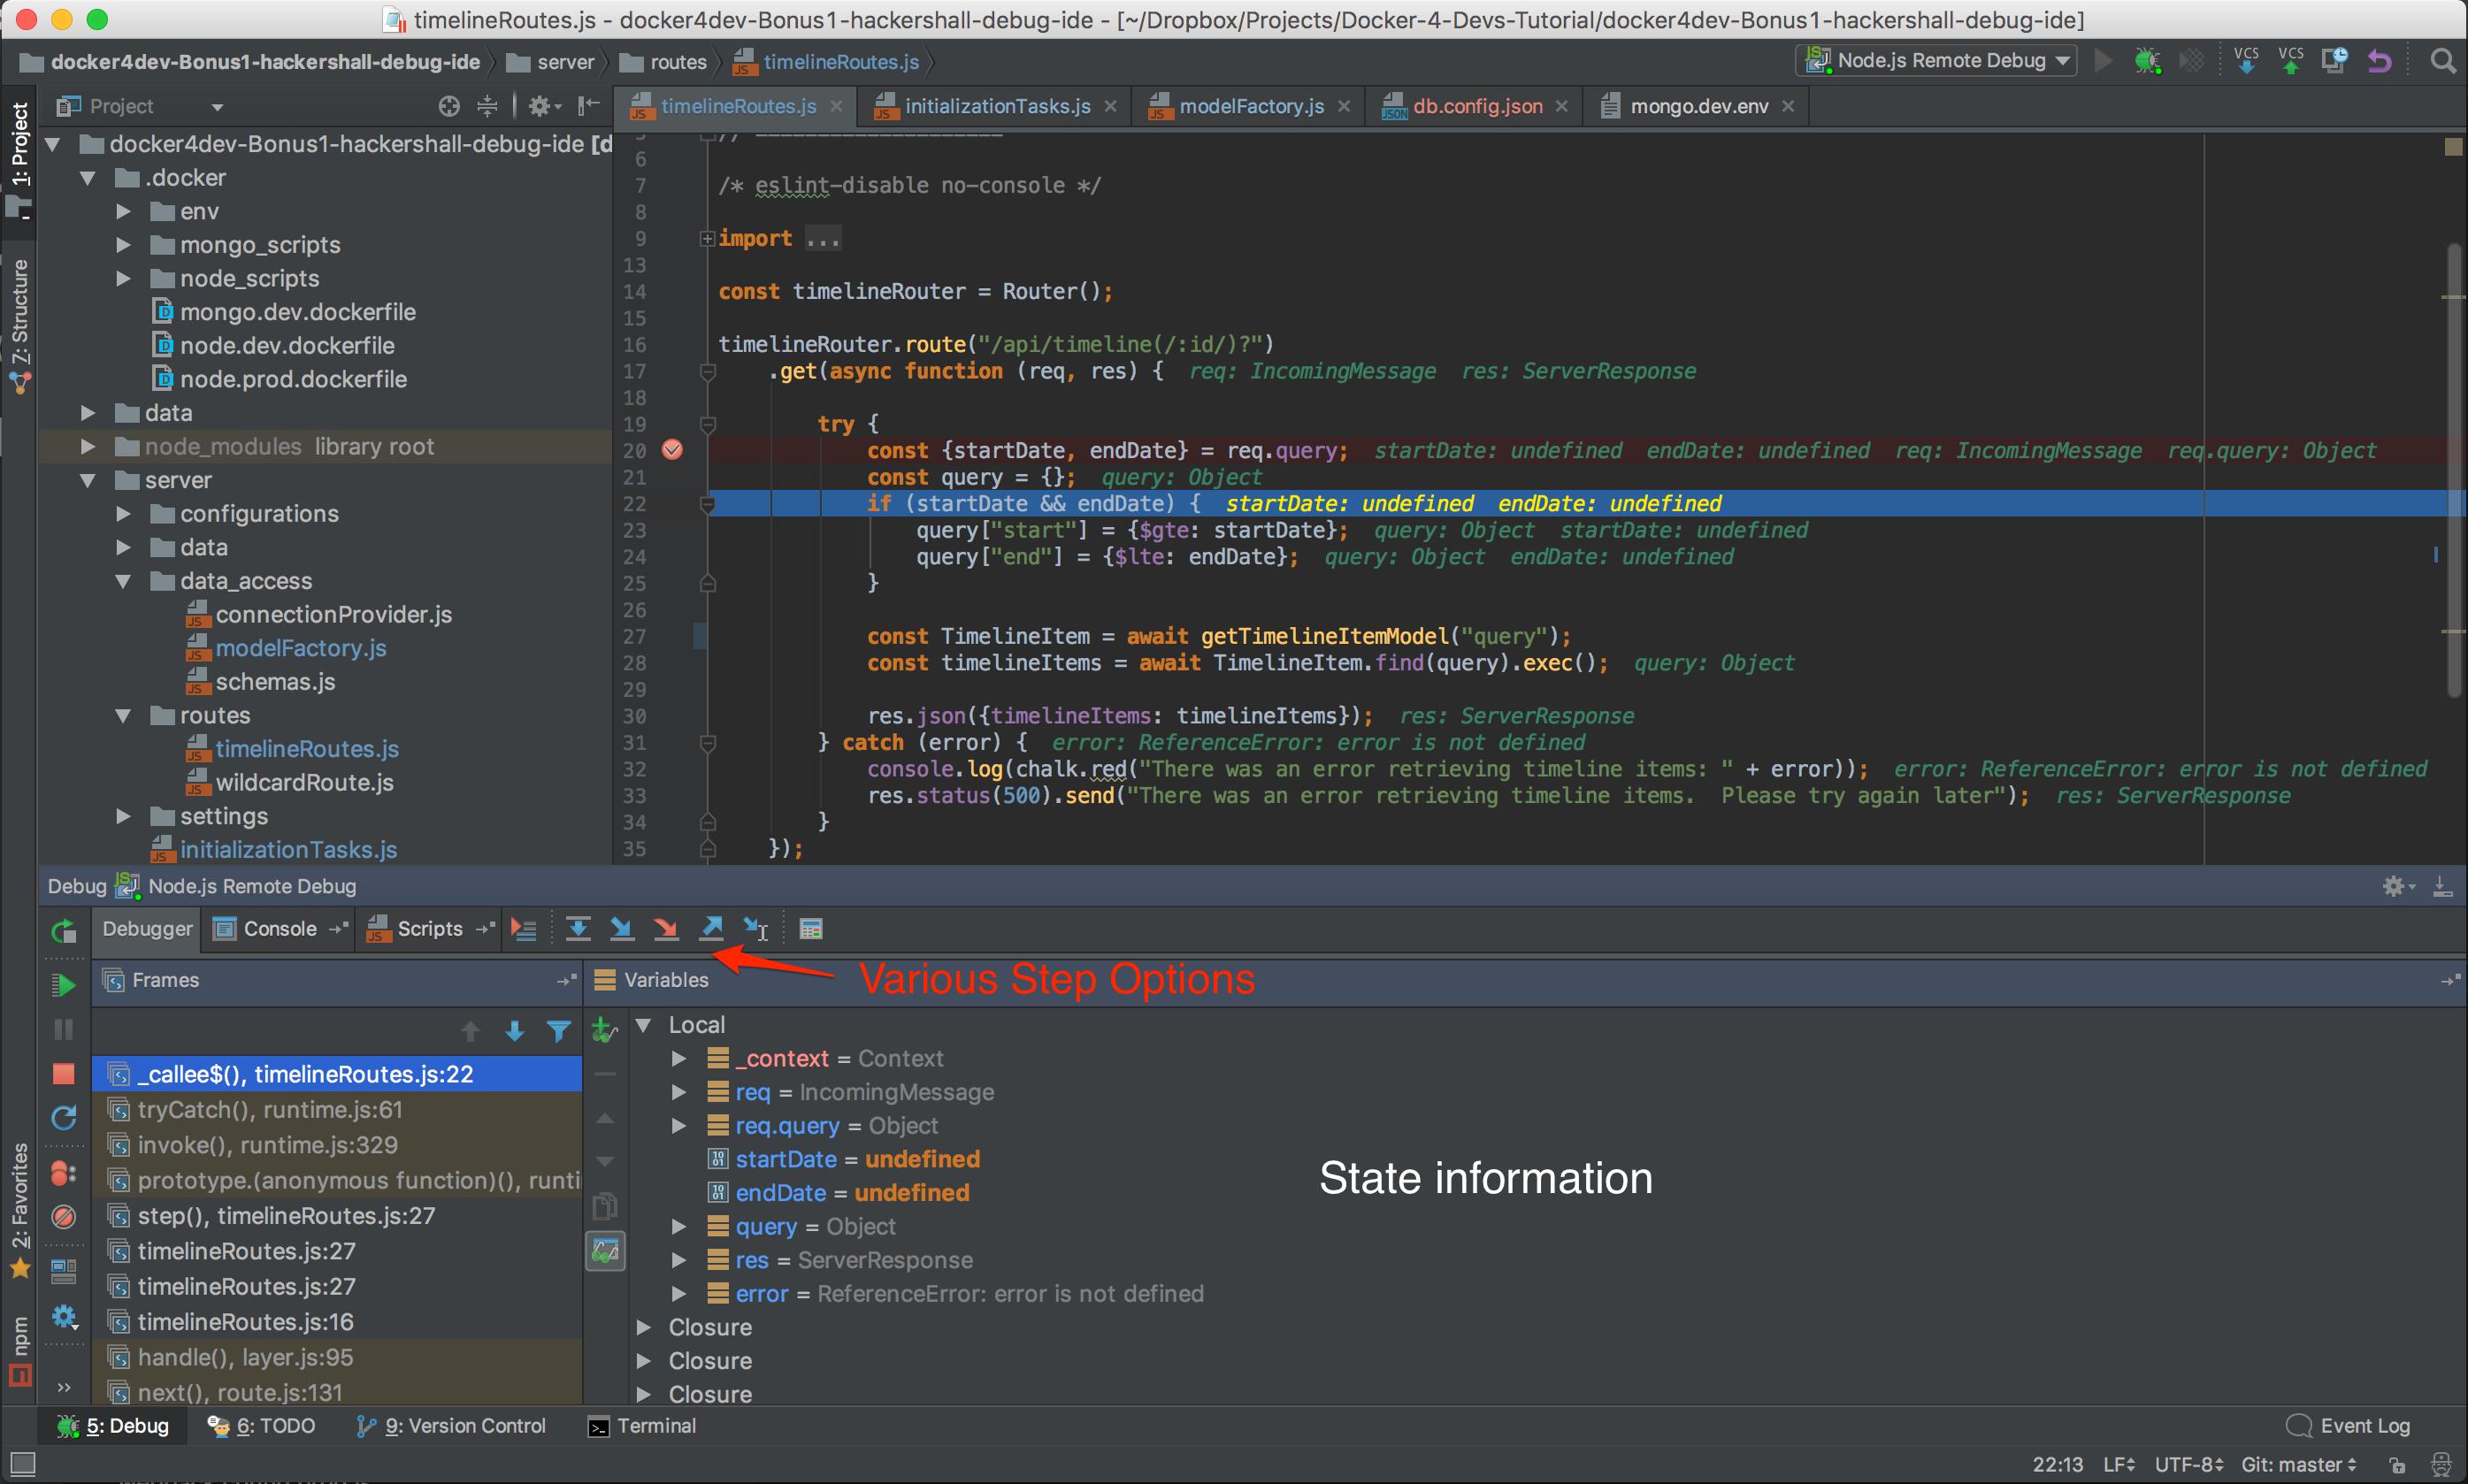
We verified the application was running back at the end of Step 2. We should now be able to setup breakpoints and trigger them from within WebStorm to debug docker container:
- From the project root, open server -> routes -> timelineRoutes.js
- Place a breakpoint on line 20 by clicking to the right of the line number
const {startDate, endDate} = req.query;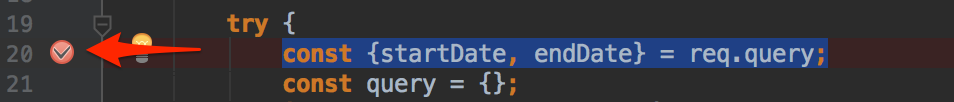
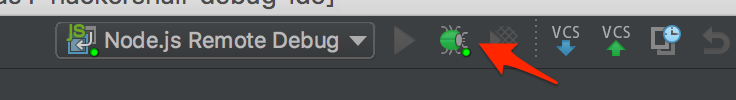
Step 4c. Start the Debug
- Click on the green Debug “Bug” icon from the same top right corner of the main WebStorm: window:
- Refresh or navigate back to http://localhost:7000 which will trigger a call to the timeline route for getting timeline events which is part of the initial request.
- Back in WebStorm we can see the breakpoint triggered and if we step over the current breakpoint also observe information on the state of the request:
What did we do?
- We created a debugging configuration for the remote interpreter plugin that would allow it to connect to the listening debugger in our app’s Docker container.
- Debug Docker container application using the WebStorm’s debugging capabilities.
- Set breakpoints in WebStorm on specific code that will be triggered.
BONUS
As part of this setup, we also configured our starting NPM script to launch nodemon so that we could make changes to our server and nodemon will restart our server with out us having to shutdown and restart the app container whether doing feature enhancement or a debug docker scenario.
- Notice that when are application started we got a message that nodemon was monitoring in our console:
hackershall-dev-app | [nodemon] 1.11.0
hackershall-dev-app | [nodemon] to restart at any time, enter `rs`
hackershall-dev-app | [nodemon] watching: *.*
hackershall-dev-app | [nodemon] starting `babel-node --debug server/server.js`
- Make a small change to the any file, for example add an additional empty line in the timelineRoutes.js file.
- Save the file
- Observe the nodemon related log messages in WebStorm’s terminal:


Nodemon is monitoring for any changes and will automatically restart the server for us. This is exceptionally handy when dealing with live editing changes when working on features that require server-side changes.
Conclusion
When you realize how to facilitate the core components required to debug docker containers, there isn’t much to it. It really boils down to exposing the proper ports on the container, creating a port mapping between the container and the host, and configuring WebStorm to know where to connect its debugging tools and that exactly what we did.